For a list of BASHing data 2 blog posts see the index page. ![]()
Adding the missing keys and values in a key-value series
In last week's post I used gnuplot to build a frequency histogram of 1198 log volumes ranging from 0.16 to 12.99 m3. This post explains how the volume data (filename "logs", header line "Volume") was prepared for plotting.
The first step was to round the volumes to 0.1 m3 and generate a key-value table with volumes and number of logs. I did this with AWK and sort:
tail -n +2 logs | awk '{a[sprintf("%0.1f",$0)]++} END {for (i in a) print i","a[i]}' | sort -n
If you'd like to try what follows, copy the "minified" CSV shown below and replace the plain spaces with newlines to generate a list of volume,number of logs key-value pairs.
Either tr " " "\n" or sed 's/ /\n/g' will do the replacement job. Save the result as "kvcsv".
0.2,3 0.3,7 0.4,20 0.5,27 0.6,45 0.7,47 0.8,53 0.9,81 1.0,49 1.1,73 1.2,56 1.3,43 1.4,43 1.5,53 1.6,56 1.7,34 1.8,26 1.9,39 2.0,31 2.1,33 2.2,23 2.3,28 2.4,25 2.5,16 2.6,22 2.7,15 2.8,20 2.9,9 3.0,12 3.1,17 3.2,19 3.3,8 3.4,10 3.5,9 3.6,8 3.7,6 3.8,13 3.9,3 4.0,7 4.1,5 4.2,9 4.3,7 4.4,8 4.5,3 4.6,8 4.7,2 4.8,3 4.9,3 5.0,6 5.1,2 5.2,3 5.3,5 5.4,2 5.5,4 5.6,3 5.7,6 5.9,2 6.0,2 6.1,1 6.2,6 6.3,1 6.4,1 6.5,1 6.6,2 6.7,2 6.8,3 6.9,2 7.1,1 7.2,2 7.5,1 8.0,1 8.8,1 13.0,1
There are lots of missing keys here, for example the long stretch between 8.8 and 13.0. If you replace the commas with spaces to build "kv", the following recipe will plot the data anyway in mlterm, because gnuplot will ignore the missing key-value pairs:
gnuplot <<EOF
set term sixelgd size 650,400
unset key
set style data histogram
set xrange [0:13.5]
set xlabel "Log volume (cu.m.)"
set xtics 1
set ylabel "No. of logs"
set boxwidth 0.05
set style fill solid
plot "kv" using 1:2 with boxes lc 18
EOF
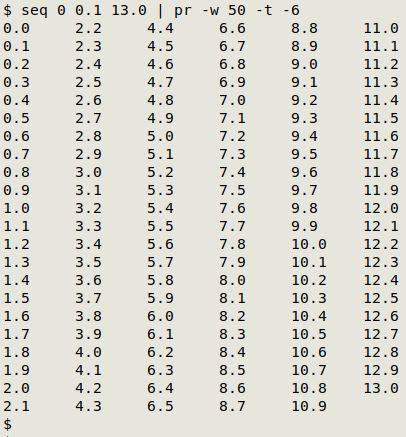
I wondered, though, how easy it would be to add those missing key-value pairs? Pretty easy, as it turns out. I first built a complete list of keys with seq:
seq 0 0.1 13.0

The pr command is only there to make the full list visible in a small screenshot for this blog post.
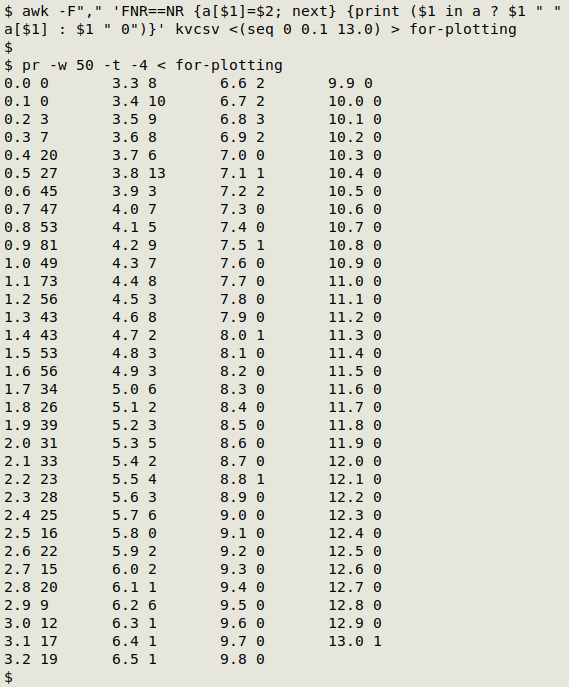
I then generated the filled-in, complete list of key-value pairs ("for-plotting") from "kvcsv" with an AWK command:
awk -F"," 'FNR==NR {a[$1]=$2; next} {print ($1 in a ? $1 " " a[$1] : $1 " 0")}' kvcsv <(seq 0 0.1 13.0) > for-plotting
AWK is here told with -F"," that the field separator in "kvcsv" is a comma. Using the FNR==NR trick, AWK first builds an array "a" whose index string is the first field (volumes) in "kvcsv" and whose value string is the second field (log numbers): a[$1]=$2.
AWK then moves to the second file (next), which is a BASH redirection from seq 0 0.1 13.0. When processing each line in this complete list of volumes, AWK prints something. What it prints is determined by the ternary expression $1 in a ? $1 " " a[$1] : $1 " 0".
The expression asks Is the first [and only] field in the complete list of volumes already an index in the array "a"? ($1 in a). If yes, then AWK prints the volume, a space and the number of logs corresponding to that volume ($1 " " a[$1]). If no, then AWK prints the volume, a space and a zero ($1 " 0").
The result was a space-separated key-value list, "for-plotting":

The gnuplot instructions for "for-plotting" in mlterm are the same as those above, but replace "kv" with "for-plotting".
Next post:
2025-01-31 The ìèñëèâñüêå mystery
Last update: 2025-01-24
The blog posts on this website are licensed under a
Creative Commons Attribution-NonCommercial 4.0 International License