
For a list of BASHing data 2 blog posts see the index page. ![]()
A plotting-in-terminal solution: sixels and mlterm
I haven't taken much notice of sixels in the past, and that's not surprising. The sixel format is a venerable bitmap graphic format originally used to send image data to Digital Equipment Corporation printers, and later for bitmap image display on DEC monitors.
I should have paid more attention. Sixels are the key to building nice graphic plots directly in a terminal, something I've wanted to do (especially with gnuplot) ever since I migrated to Linux in 2007.
Before I do some demos here, I need to expand on "in a terminal", because not every terminal emulator supports sixels. The delightfully named website Are We Sixel Yet? lists the emulators that do and do not allow sixel plotting, and unfortunately my daily-use, VTE-based terminal sakura isn't supported.
The terminal emulator I chose for plotting is mlterm. It's available in the repositories and has a very long and detailed man page. The introduction begins:
mlterm is a multi-lingual terminal emulator written from scratch, which supports various character sets and encodings in the world and complex characters such as double width for East Asian, combining for Thai, Vietnamese, and so on, and bi-direction for Arabic and Hebrew. Indic scripts are experimentally supported. It also supports various unique feature such as anti-alias using FreeType, multiple XIM, multiple windows, scrollbar API, scroll by mouse wheel, automatic selection of encoding, daemon mode, and so on.
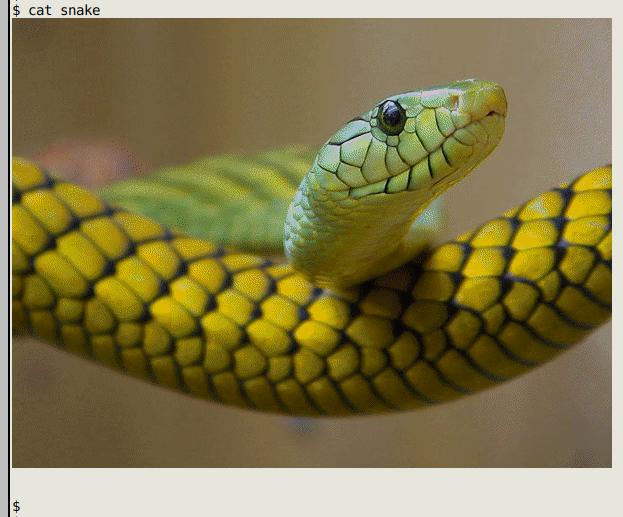
Configuring mlterm isn't simple but I got it looking something like my sakura after studying the man page and this guide. For a test, I downloaded the 250KB, plain-text sixel file "snake.six" from the libsixel image library on GitHub, saved it as "snake" and opened it in mlterm with a simple "cat" command:
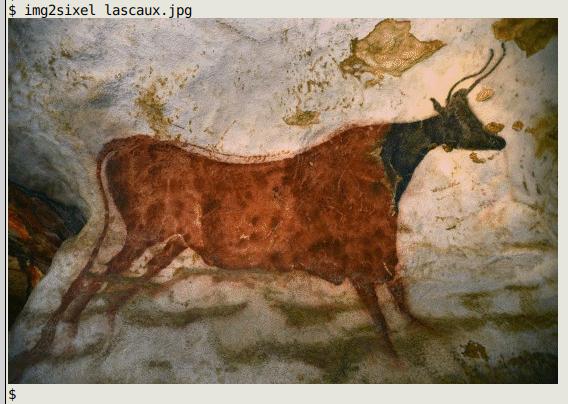
You can display a non-sixel image in a sixel-aware terminal with the img2sixel command, included in the libsixel-bin binary available in the repositories. Just run the command on an image with no output file, in other words to stdout:
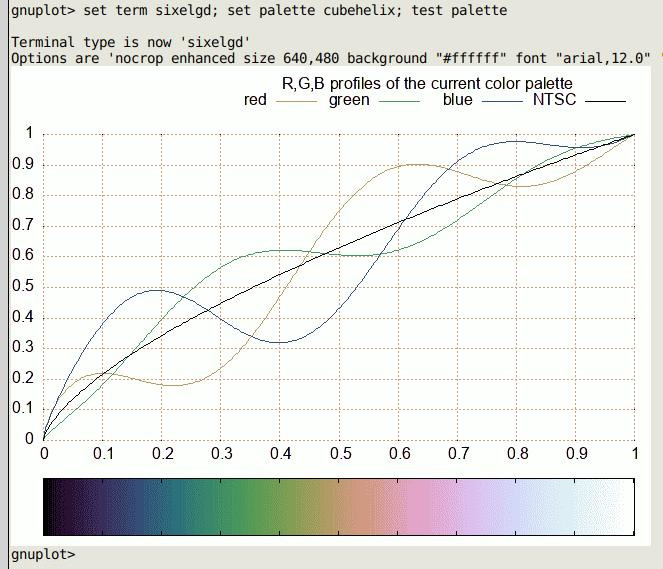
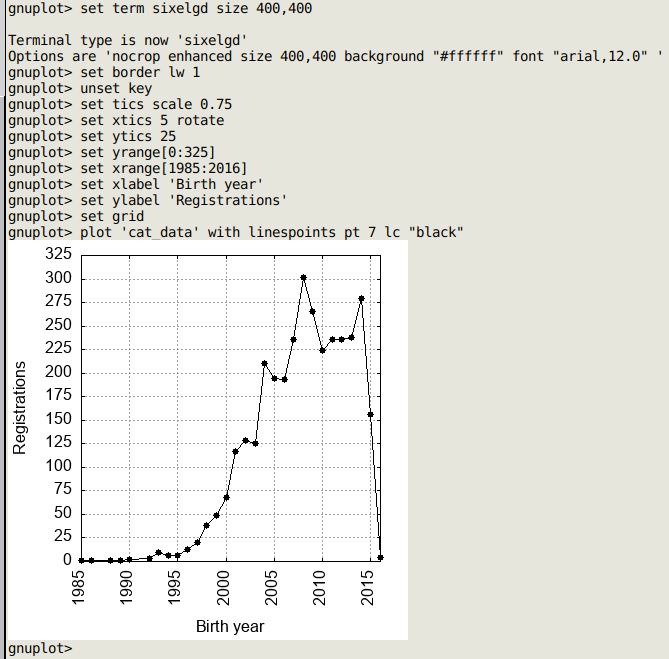
gnuplot-ting. The latest versions of gnuplot allow for a "sixelgd" terminal, which displays the image output in the (mlterm) terminal, rather than in a separate gnuplot window:
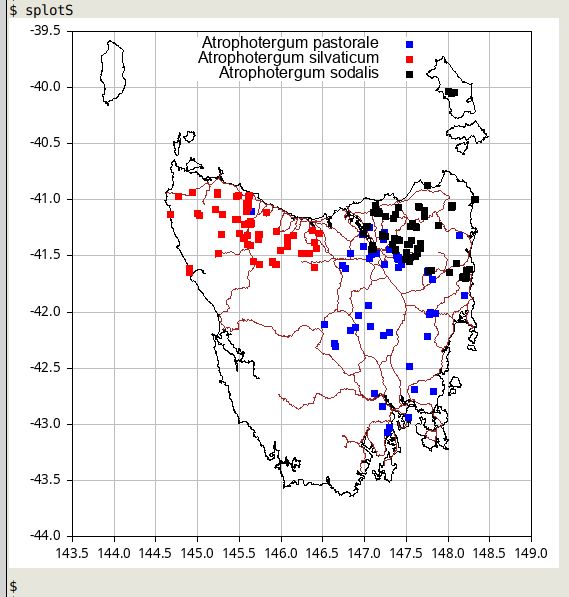
My scripted gnuplot commands work well with sixel output. Below I show the result of running a sixel version of the "splot" script called "splotS", which plots millipede localities on a map of Tasmania. I changed
set term qt size 650,650 position 300,100 persist
in the "splot" script to
set term sixelgd size 550,550 anchor truecolor rounded
in "splotS":
Finally, here's an in-terminal plotting of the cats dataset I struggled with back in 2019:
For more ideas on using sixel graphics I highly recommend the libsixel page on GitHub.
Last update: 2024-10-04
The blog posts on this website are licensed under a
Creative Commons Attribution-NonCommercial 4.0 International License
Coming up:
2024-10-11 USV: The Unicode Separated Values format
2024-10-18 How to force a preferred array sort in AWK
2024-10-25 Anatomy of a data analysis
2024-11-01 Easy and not-so-easy ways to time a process