
For a full list of BASHing data blog posts, see the index page. ![]()
Plotting data in the terminal with gnuplot
For many years (33!) the best command-line data plotter has been gnuplot, a C program still under active development. gnuplot is fast and flexible and builds attractive graphics; I've even used it as a simple GIS.
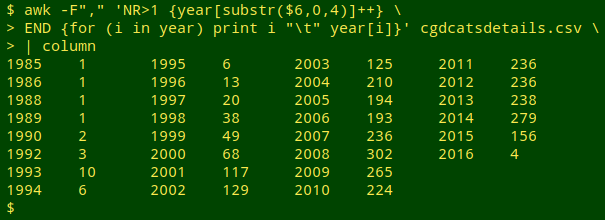
One obstacle to running gnuplot for some users is the complexity of the configuration file needed to build a plot. You can't just throw some data at gnuplot and expect it to build you a nice graph. As an example I'll use the cat data file "cgdcatsdetails.csv" from a previous BASHing data post. From the file I'll total the cat registrations by birth year with AWK:
If I save the result as the file "cat_data" (uncolumnated) I can make a gnuplot graph with an appropriate configuration file:
awk -F"," 'NR>1 {year[substr($6,0,4)]++} END {for (i in year) print i " " year[i]}' cgdcatsdetails.csv > cat_data && gnuplot cat_data_config
cat_data_config:
reset
set term wxt size 400,400 persist
set border lw 1
unset key
set tics scale 0.75
set xtics 5 rotate
set ytics 25
set yrange[0:325]
set xrange[1985:2016]
set xlabel 'Birth year'
set ylabel 'Registrations'
set grid
plot 'cat_data' with linespoints pt 7 lc "black"
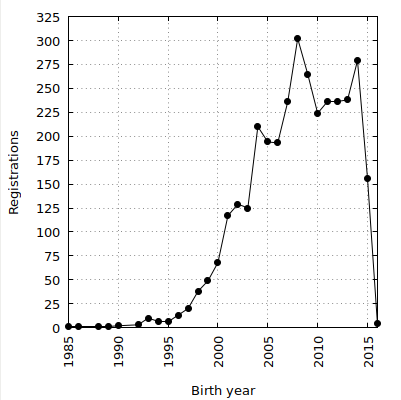
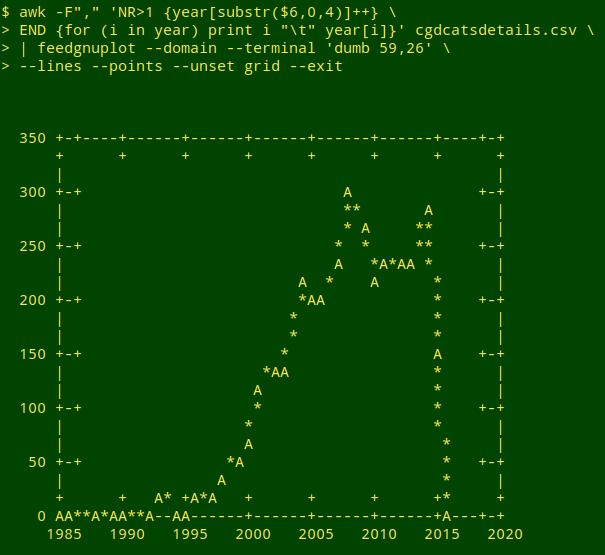
This graphic appears in a separate window floating above my terminal. It's pretty, but sometimes I might want to plot some data directly in the terminal, without having to build a configuration file or specify lots of gnuplot options on the command line. To do that I can pipe the data command output to gnuplot -e, specify set term dumb and get gnuplot to plot stdin with plot '-'. In the command shown below I've set the terminal size to 59 characters wide and 26 lines high (more on that in a moment), and added notitle to avoid having '-' (the "name" of the plotted data) appear on the graph:
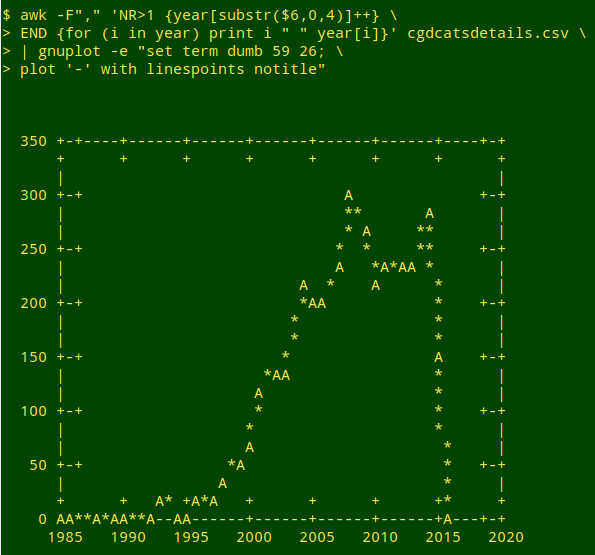
Notice that gnuplot has automatically identified the first column in the space-separated data table as the "x" values. gnuplot isn't so clever at scaling the axes. I chose a 59-character width and a 26-line height by trial and error to ensure that with this particular plot, the "x" and "y" tics would be evenly spaced. With the default sizing, the result is irregular (screenshot shrunk to fit blog width):
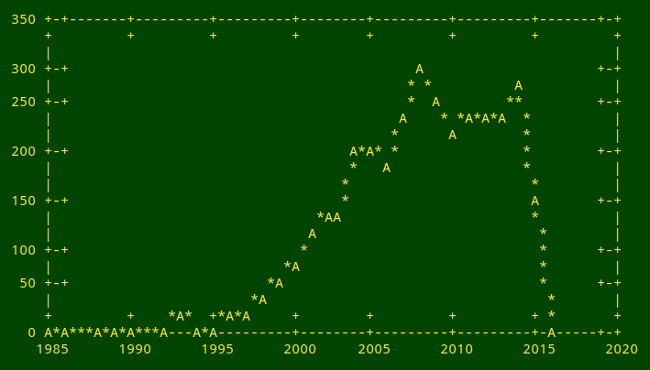
I haven't found a workaround for this particular issue, which is also apparent in some online dumb terminal demonstrations, like this one and this one. gnuplot has an "autoscale" feature (described here), but it doesn't seem to work in a terminal.
There are a couple of command-line "front-ends" for gnuplot that can sometimes make gnuplotting a little easier. One is feedgnuplot, which is available in the Debian and Ubuntu repositories and also on GitHub, and has an explainer here. The --domain option lets feedgnuplot use the first data column for x values, terminal type and size can be set with --terminal and an --exit option is used to close the command. The defaults are to print a grid and not to print a title; the grid can be avoided with --unset grid.
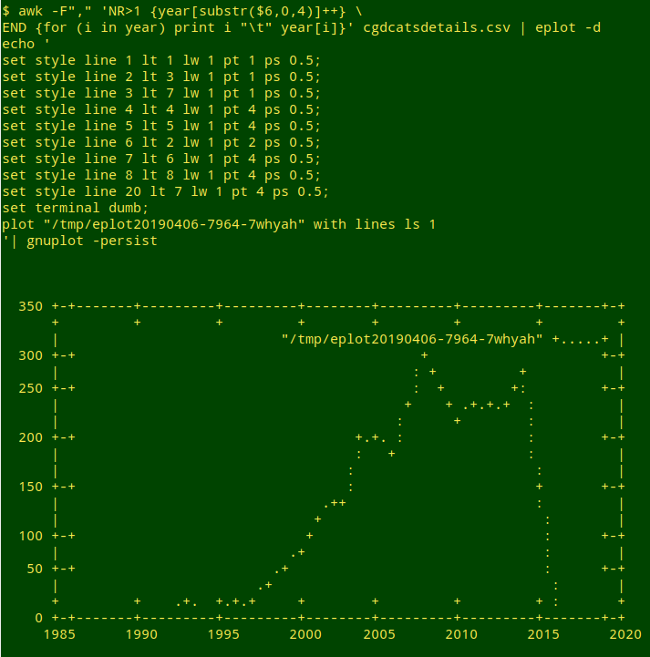
Another gnuplot front-end is eplot, written in Ruby and available on GitHub as a pair of self-contained executables; I copied mine to /usr/local/bin. The eplot command for terminal plotting is simple — just eplot -d — and the output looks good, but I haven't found a way to resize the plot or avoid having eplot print out its configuration and a plot title:
I think I'll stick with gnuplot's separate graphic window for everyday uses!
Last update: 2019-06-21
The blog posts on this website are licensed under a
Creative Commons Attribution-NonCommercial 4.0 International License