
For a full list of BASHing data blog posts see the index page. ![]()
Moving averages with AWK
Moving averages can be used to smooth out some of the variation in a data series. The chart below shows the monthly average prices of West Texas intermediate crude oil over a 5-year period. The black line connects raw data points, and the (smoother) red line connects averages of every 5-month period, plotted at the middle month of the 5.
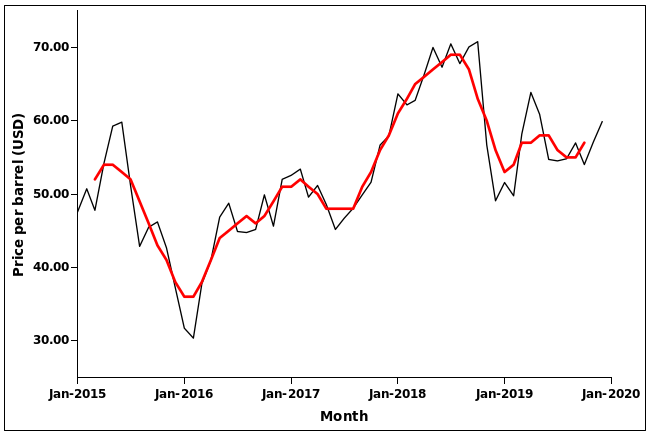
Notice that the moving-average line starts later and finishes earlier than the raw data line, because the first 5-month average has month 3 as its middle month for plotting, and the middle month of the last 5-month average is the last-but-two month in the data series. Plotting the middle point of an odd-numbered series is a graphical convenience, and 5-point averages are commonly used because 3-point averages don't do much smoothing, and 7- and higher-point averages leave large "bare patches" at the start and end of the series.
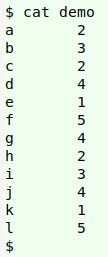
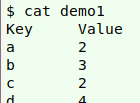
There are a number of ways to calculate moving averages with AWK. The method I'll demonstrate here is based on an ingenious command from Norwegian mathematician Håkon Hægland in a 2014 Stack Overflow post. I'll start with the simple, tab-separated file "demo":
Below is a basic AWK command for generating the 5-point averages at each of the plotting (middle) points. (The command is explained in detail at the bottom of this page.)
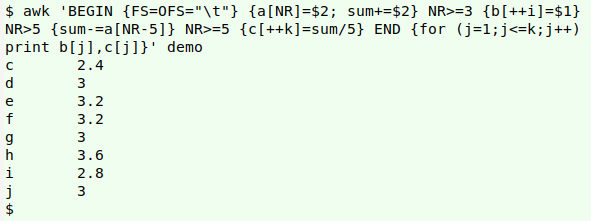
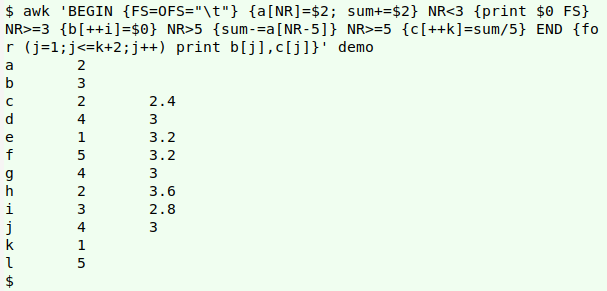
That's sort of a "core" result. It would be better to see the 5-point averages in the context of the original table, so I'll tweak the AWK command:
The next tweak is for realism. Most data tables have header lines, so I'll add a header to "demo" and rename it "demo1":
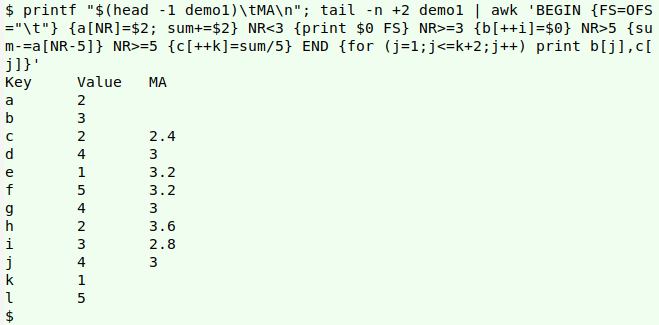
Rather than re-build the AWK command, I'll feed it "demo1" with the header stripped off, after generating a header line for the output table:
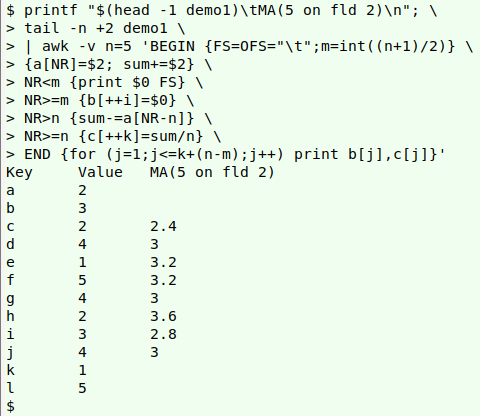
A final tweak is to replace the "2", "3" and "5" in the AWK command, which are specifically for a 5-point moving average. To generalise I'll put the moving-window size in a variable "n" at the start of the AWK command, and get the middle point "m" by calculation in the BEGIN statement. I can also note in the header line the window size and the field in which it moves:
I couldn't possibly remember that long command, so I've put it in a shell function, "ma", with arguments for filename, window size and field to be moving-averaged. Note that the AWK command is written to work on tab-separated tables with a single header line and no missing values:
ma [filename] [window size] [field]
ma() { printf "$(head -1 $1)\tMA($2 on fld $3)\n"; tail -n +2 "$1" | awk -v n="$2" -v FLD="$3" 'BEGIN {FS=OFS="\t"; m=int((n+1)/2)} {a[NR]=$FLD; sum+=$FLD} NR<m {print $0 FS} NR>=m {b[++i]=$0} NR>n {sum-=a[NR-n]} NR>=n {c[++k]=sum/n} END {for (j=1;j<=k+(n-m);j++) print b[j],c[j]}'; }
Memo to self: modify command sometime so that the "n" in c[++k]=sum/n is the number of non-missing values in each "n"-sized window.
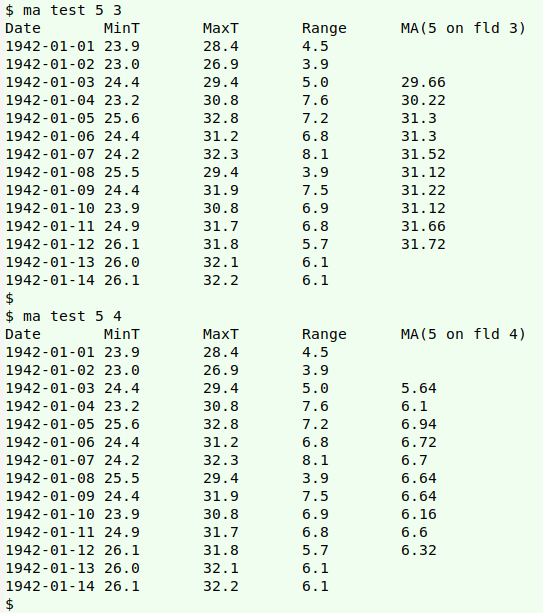
The screenshot below shows "ma" doing 5-day moving averages on two different fields in "test" (some daily temperature data from a previous BASHing data post).
To understand how the basic command works, it helps to follow AWK as it processes "demo":
awk 'BEGIN {FS=OFS="\t"} \
{a[NR]=$2; sum+=$2} \
NR>=3 {b[++i]=$1} \
NR>5 {sum-=a[NR-5]} \
NR>=5 {c[++k]=sum/5} \
END {for (j=1;j<=k;j++) print b[j],c[j]}' demo
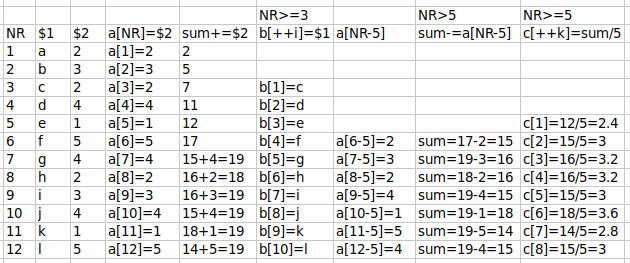
As each line is processed, the array "a" fills. Each item in the array has the line number as index string and the entry in field 2 as value string.
Also as each line is processed, the variable "sum" increments with the entry in field 2. sum+=$2 is shorthand for sum=sum+$2; the new value of "sum" is the old value plus whatever is in field 2. That incremented value of "sum", however, is recalculated beginning with line 6 (see spreadsheet screenshot), and it's that recalculated value that's incremented with sum+=$2 in the next line.
Beginning with line 3 (NR>=3), the array "b" fills. The index string is a counter number "i" starting with 1, and the value string is the entry in field 1.
Beginning with line 6 (NR>5), AWK recalculates the "sum" already calculated earlier in the command. From the existing "sum" it subtracts the value string from the array "a" that was indexed to the line number 5 less than the current line number. (sum-=a[NR-5] is shorthand for sum=sum-a[NR-5].)
Beginning with line 5 (NR>=5), AWK computes the final value of "sum" for that line divided by 5, and makes that the value string in an array "c" indexed with the counter number "k".
In the END statement after all lines have been processed, AWK loops through arrays "b" and "c" and prints their value strings. The starting index value is 1, so b[1]=c and c[1]=2.4 (see spreadsheet screenshot). The finishing index value is 8, because that's the highest count reached by the counter "k", and b[8]=j and c[8]=3.
The tweak to add the "unaveraged" first 2 lines (NR<3 {print $0 FS}) prints each line followed by a tab, which creates an empty string as the third field in the output table.
To add the lines preceding the average values, I use the whole line as value string in the array "b" ({b[++i]=$0}).
To add the last 2 lines after the averaged ones, I extend the loop in the END statement by 2 (for (j=1;j<=k+2;j++)). AWK prints all the items in the "b" array, here ending with b[9]=k and b[10]=l. However, there are no items with index strings "9" and "10" in the array "c", so AWK prints empty strings instead.
Last update: 2020-03-04
The blog posts on this website are licensed under a
Creative Commons Attribution-NonCommercial 4.0 International License