
For a full list of BASHing data blog posts see the index page. ![]()
Steady as she goes, in Darwin
I live in Tasmania at the cool, southern end of Australia. We not only get several weather seasons in the year, we often get several in one month. Sometimes we get two in one day. For this reason I marvel at the daily weather forecast for Darwin, ca 3500 km away in Australia's tropical north. It always seems to be about 23 C to about 33 C in Darwin. Sounds lovely.
But is that right? Surely the daily minimum and maximum temperatures in Darwin vary a lot more than that?
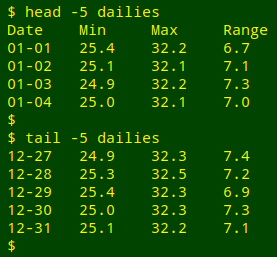
To find out, I downloaded all the available daily min/max temperatures for Darwin Airport as text files from the Bureau of Meteorology (Australia) website. The records begin on 1 February 1941 and I cut them off on 28 September 2019 (a couple of days before I wrote this post). Of the 28729 days, 187 have no temperature records, 58 have only a minimum and 87 have only a maximum. I deleted these 332 records (1.2% of the total) to get 28397 days over the past 78 years with both minimum and maximum recorded temperatures. I worked up the records into the tab-separated file "dtsc" with ISO 8601 date (YYYY-MM-DD), minimum temperature, maximum temperature and temperature range for each of the 28397 days.
To average the min, max and range on each of the 366 calendar dates I used the following command, which builds the file "dailies":
(printf "Date\tMin\tMax\tRange\n"; \
awk -F"\t" 'NR>1 {days[substr($1,6,5)]++; \
min[substr($1,6,5)]+=$2; \
max[substr($1,6,5)]+=$3; \
range[substr($1,6,5)]+=$4} \
END {for (i in days) \
printf("%s\t%0.1f\t%0.1f\t%0.1f\n", \
i,(min[i]/days[i]),(max[i]/days[i]),(range[i]/days[i])' dtsc \
| sort) > dailies
The header line for "dailies" is built with printf "Date\tMin\tMax\tRange\n". Following the header is the output of an AWK command, piped to sort.
AWK processes all the lines in "dtsc" except the header (NR>1) and treats tab characters as field separators (-F"\t"). AWK builds 4 arrays as it processes "dtsc", using as index string for each array the month and day from the ISO 8601 date (substr($1,6,5)). The array "days" simply tallies the different calendar days (days[substr($1,6,5)]++). "min" sums up the minimum temperatures for each calendar day (min[substr($1,6,5)]++) and "max" and "range" do the same for maximum temperatures and daily ranges.
When all of "dtsc" has been processed and the 4 arrays loaded, AWK moves to the END statement, where it acts on each of the 366 calendar days in "days" (for (i in days)). For each calendar day it prints the day string "i", a tab, the minimums sum divided by the total number for that calendar day in "dtsc" (min[i]/days[i]), a tab, the maximums sum divided by the total number for that calendar day, a tab, and the range sum divided by the total number for that calendar day. sort puts the output in calendar date order.
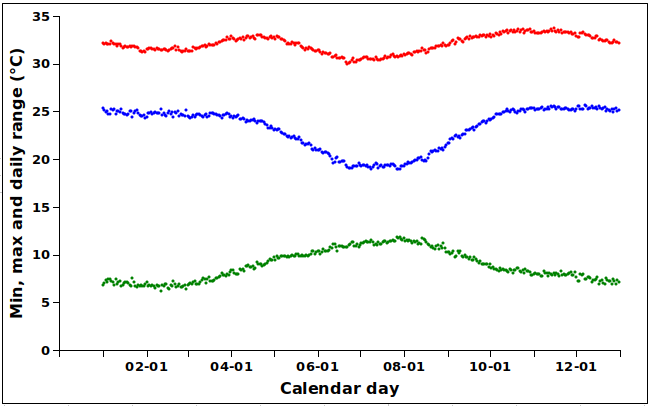
Below is a plot of "dailies" from Gnumeric. On average, Darwin's minimum temperatures only ranged from 19.0 to 25.7 through the year, while maximums had an even smaller annual range, 30.0 - 33.7. Daily swings over 10 degrees happened most often in midwinter (11.8 degrees on 29 July), but for most of the year the difference between minimum and maximum temperature averaged 6-10 degrees.
So Darwin's temperatures are indeed pretty steady, on average. To look at the variation in daily range for the period 1941-2019 I went back to "dtsc" and fired up GNU datamash:
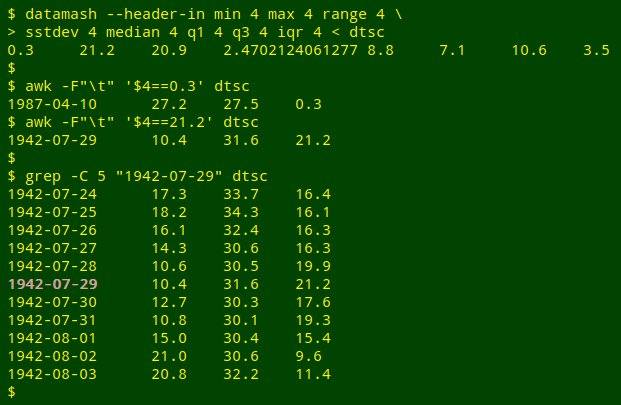
The smallest daily range, 0.3 C, was recorded on 10 April 1987, and the biggest, 21.2 C, on 29 July 1942 during a brief spell of cool nights and hot days. The sample standard deviation for daily range was only 2.5 C. The median daily range was 8.8 C, with 25% of the ranges 7.1 C or less (first quartile, q1), 25% 10.6 C or greater (third quartile, q3) and half the observed daily ranges (interquartile range, IQR) in the small range 7.1 - 10.6 C.
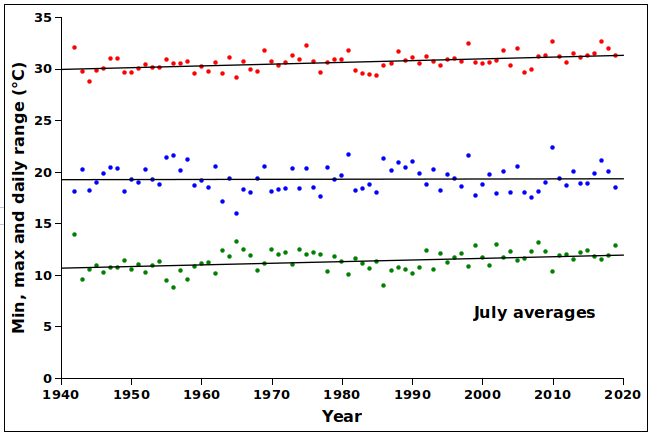
Nice and steady, but were there any obvious trends over the years? I looked at monthly averages as one way to detect trends, namely the averaged min, max and range figures for the months of January and July. Because there were no January records for 1941, I extracted the 77 years 1942-2019 from "dtsc" as the file "dtscA". The command was:
(printf "Year\tMin\tMax\tRange\n"; \
awk -F"\t" '$1 ~ /-01-/ {years[substr($1,0,4)]++; \
min[substr($1,0,4)]+=$2; \
max[substr($1,0,4)]+=$3; \
range[substr($1,0,4)]+=$4} \
END {for (i in years) \
printf("%s\t%0.1f\t%0.1f\t%0.1f\n", \
i,(min[i]/years[i]),(max[i]/years[i]),(range[i]/years[i]))}' dtscA \
| sort) > jan
This command is similar to the "dailies" one, but the arrays are indexed on the year portion of the ISO 8601 date (substr($1,0,4)]) and the records selected for processing have "-01-" (January) in the "Date" field ($1 ~ /-01-/); the output is saved in the file "jan". The file "jul" was built the same way but with $1 ~ /-07-/.
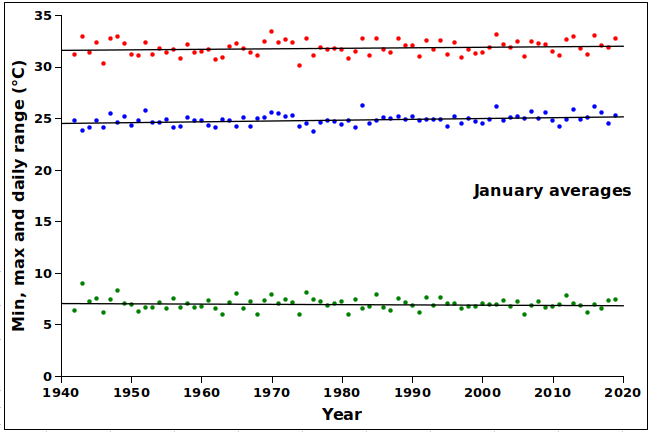
The January and July graphs are shown below, with regression lines fitted to the plots. I can almost believe that I see slight increases in min and max for January, with no trend in the daily range because the min and max increases are in parallel. In the July figures I think I see a slight upward trend in daily maximum temperatures but no trend in minimums. The result is that the daily ranges in July may be increasing slightly, in parallel with the increasing maximums.
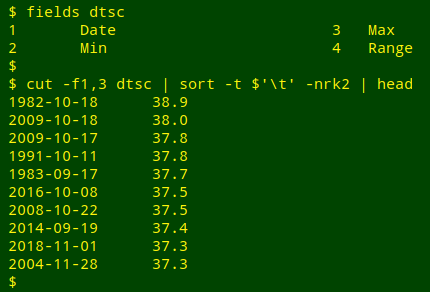
Considering that daily maximum temperatures are typically in the range 30-35C, you might be wondering what Darwin's hottest recorded day was like. Forty-something? Nope, just under 39 C, on 18 October 1982:
Last update: 2019-10-25
The blog posts on this website are licensed under a
Creative Commons Attribution-NonCommercial 4.0 International License