For a list of BASHing data 2 blog posts see the index page. ![]()
Millipedes and maps
When I'm not auditing data I have a second life as a millipede specialist. Part of that second life is managing biological records for the native millipede species of Tasmania and also managing a website devoted to these fascinating animals.
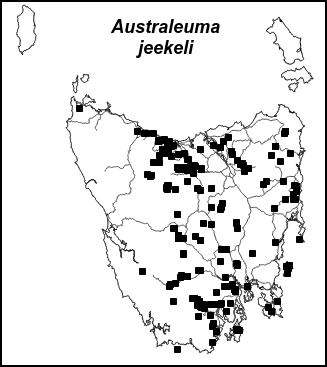
Until recently the record-managing and the website-managing were completely separate jobs. On the website, 140 of the ca 200 Tasmanian millipedes each has its own distribution map, like this one:

I built the original set of maps some years ago using QGIS as a map plotter, and GIMP for tweaking the images generated by QGIS. The maps hadn't been updated with new millipede records because the new records didn't change the distribution pictures very much, and because the QGIS/GIMP workflow was fairly slow and tedious.
But new and geographically interesting records were steadily accumulating, so I wrote a shell script ("splotweb") to generate website maps programmatically. The script is shown below (bottom of page) and this post explains how it works.
Records. My millipede records are in a plain-text TSV called "tasmilrecs". This 49-field table is built (in part) on the command line from a "names" TSV with details of the biological classification of each species, and an "events" TSV with millipede collecting details. The "tasmilrecs" table combines "names" and "events" data with information about the specimen, such as number, gender, life stage, museum where the specimen is deposited, museum catalog number etc.
The fields in the 3 tables comply with the Darwin Core standard for biological recording. I enter new data with YAD forms and check for correctness, completeness and consistency with command line tools.
Yes, this sounds like a relational database without a database! Years ago I kept names, events and specimens tables in SQLite, but I found it simpler and easier to manage plain-text TSVs on the command line with shell tools and AWK.
Script. The "splotweb" script starts by moving to the ~/Millipedes/Core directory where I keep my data tables. It then builds a series of variables.
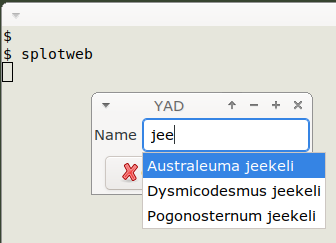
The "list" variable is a !-separated string of the unique names from one of the "names" table fields. The names are in the form "Australeuma jeekeli" (genus + species) or "Dalodesmidae sp. M34" (higher taxon + codename). YAD uses "list" to make a name selector which works as described in last week's BASHing data 2 post. As shown below, I enter "jee" and YAD finds matching strings in "list". I select the one I want using the up/down arrow keys, then press Enter, then Enter again to move on in the script.

The selected name is stored in the "name" variable. This variable is used to build 3 more variables. "abbrev" is a unique 6-character code (like "ausjee") from the "names" table; it will later be used in the map image filename. "first" is the first part of "name", in this case "Australeuma", and "second" is whatever follows "first", in this case "jeekeli".
Next, AWK looks in "tasmilrecs" for records for the species selected in "name". It extracts the longitude and latitude of the records, sorts and uniquifies them, and saves the coordinates in the temporary file "toplot".
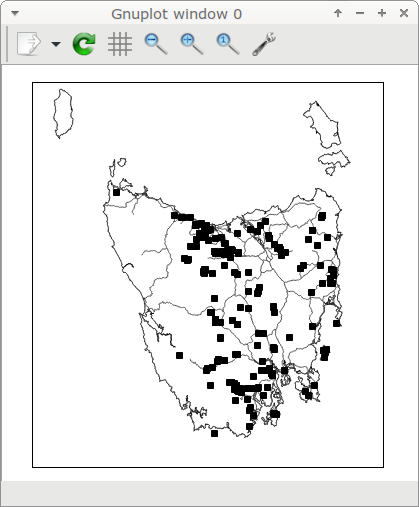
"toplot" is plotted by gnuplot as explained in an earlier BASHing data 2 post, but this time with the "qt" terminal rather than the "wxt" one. The map pops up in a new window:

While I'm inspecting the map, the scrot screenshot utility grabs a 323x363 pixel rectangle (appropriately placed) from the gnuplot window, which is the active window until I press q to close it. The screenshot is saved as the temporary file "scrot.png".
The last jobs in the script are done by ImageMagick's convert. First a 2-pixel wide black border is added to "scrot.png". This makes the overall image size 327x367 pixels, which is the standard size for all the maps on the millipedes website.
convert then adds the species name to the image in 18-point Arial bold italic. The text is placed at the top centre of the image, with a "down" offset of 15 pixels. The added text consists of "first" and "second" with a newline between. The 327x367 image with its added text is saved to my desktop with its codename, in this case "ausjee.png". ImageMagick's display command then shows the map for a final check (I close this ImageMagick window with q), and the script deletes the 2 temporary files.
What I like best about the "splotweb" script is that it's entirely keyboard-operated in a terminal. I don't need to do a heap of mouse-clicking, as I did when building the maps with QGIS and GIMP!
Why do I take a screenshot of the gnuplot window? Why not just build a PNG with gnuplot and modify that map image with ImageMagick directly? Because I tried gnuplot's PNG options, and none of them gave me a map I liked as much as the one built with the "qt" terminal.
#!/bin/bash
cd ~/Millipedes/Core
list=$(tail -n +2 names | cut -f8 | sort | paste -s -d "!")
name=$(yad --posx="100" --posy="100" --form --separator="" --complete="any" --field="Name":CE "$list")
abbrev=$(awk -F"\t" -v species="$name" '$8==species {print $10}' names)
first=$(cut -d" " -f1 <<<"$name")
second=$(cut -d" " -f2- <<<"$name")
awk -F"\t" -v verbid="$name" '$8==verbid {print $30 FS $29}' tasmilrecs | sort | uniq > toplot
gnuplot 2>/dev/null <<EOF
set term qt size 415,415 position 300,100 persist
set size ratio 1.1
set style line 1 lc rgb "black" lw 1.0
set style line 2 lc rgb "gray30" lw 1.0
set xrange [143.5:149.0]
set yrange [-44.0:-39.5]
unset xtics
unset ytics
unset tics
unset grid
plot "tas3" with lines linestyle 1 notitle
replot "roads3" with lines linestyle 2 notitle
replot "toplot" with points pt 5 lc "black" ps 1 notitle
EOF
scrot -d 1 -a 339,186,323,363 scrot.png
convert scrot.png -bordercolor black -border 2x2 \
-gravity north -pointsize 18 -font "Arial-Bold-Italic" \
-annotate +0+15 "$first\n$second" ~/Desktop/"$abbrev".png
display ~/Desktop/"$abbrev".png
rm scrot.png toplot
exit
Last update: 2024-08-16
The blog posts on this website are licensed under a
Creative Commons Attribution-NonCommercial 4.0 International License