For a full list of BASHing data blog posts see the index page. ![]()
Mapping with gnuplot, part 3
In the last post I explained how I built a base map of Tasmania (coastline plus main roads) with a lat/lon grid using gnuplot. Here I describe how the base map was used to generate GIF animations.
Plotting some points. The data file I'll use in this demonstration ("bro") has year, longitude and latitude:
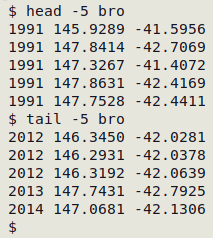
The data are from collections of the strange millipede genus Bromodesmus, which only lives in Tasmania. What I want to do is animate collection localities by year, with the "working" year localities in red and the previous localities in blue. The following variation on the "smallbase" configuration file will do that for 1992, with the new lines or new items in the code shown in bold:
set terminal png size 620,620
set output "1992.png"
set size ratio 1.1
set style line 1 lc rgb "gray" lw 0.5
set style line 2 lc rgb "black" lw 0.5
set format x "%0.1f"
set format y "%0.1f"
set xrange [143.5:149.0]
set yrange [-44.0:-39.5]
set xtics 0.5
set ytics 0.5
set tics nomirror out font "Sans, 8"
set grid linestyle 1
unset key
set label font "Sans, 14" "{/:Bold 1992}" at first 146, first -40.25
plot "tas3" with lines linestyle 2, \
"roads3" with lines linestyle 1, \
"bro" using 2:($1==1992 ? $3 : NaN) with points pt 5 lc rgb "red" ps 1, \
"bro" using 2:($1<1992 ? $3 : NaN) with points pt 5 lc rgb "blue" ps 1
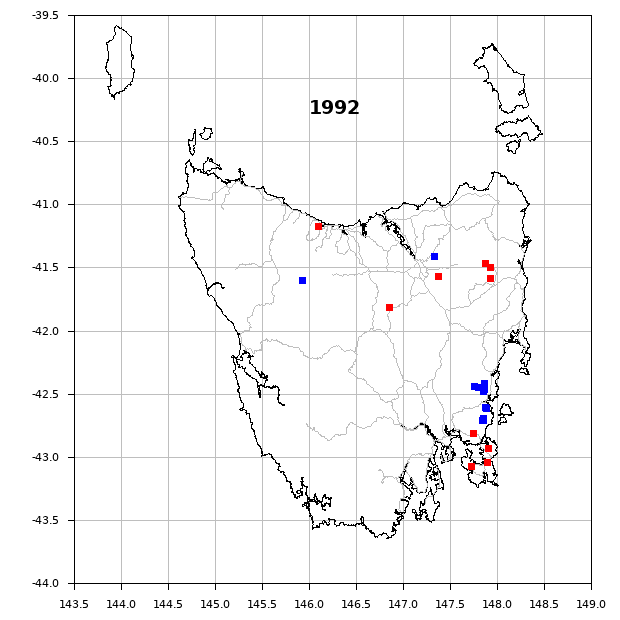
The changes from "smallbase" are to set a label with the "working" year 1992, change the output PNG filename to "1992" and plot two sets of points from "bro". For the first set I use the conditional expression $1 == 1992 ? $3 : NaN, which means If the numerical value in the first column is 1992, use column 3 for plotting, otherwise don't plot anything. For this conditional the points are red. The second set of points is determined by the conditional $1 < 1992 ? $3 : NaN, which looks for data lines where the first column value is less than 1992, and for "bro" that means just 1991. These points are blue.
The "bro" file has years missing from column 1, because no Bromodesmus were collected in those years. The first conditional $1 == YEAR ? $3 : NaN will fail for those years, and nothing will be plotted except the localities from all the previous years.
Building a collection of year plots. Notice that the only thing that will change in the gnuplot configuration file (above) from year to year are the four occurrences of the year value, shown below in red:
set terminal png size 620,620
set output "YEAR.png"
set size ratio 1.1
set style line 1 lc rgb "gray" lw 0.5
set style line 2 lc rgb "black" lw 0.5
set format x "%0.1f"
set format y "%0.1f"
set xrange [143.5:149.0]
set yrange [-44.0:-39.5]
set xtics 0.5
set ytics 0.5
set tics nomirror out font "Sans, 8"
set grid linestyle 1
unset key
set label font "Sans, 14" "{/:Bold YEAR}" at first 146, first -40.25
plot "tas3" with lines linestyle 2, \
"roads3" with lines linestyle 1, \
"bro" using 2:($1==YEAR ? $3 : NaN) with points pt 5 lc rgb "red" ps 1, \
"bro" using 2:($1<YEAR ? $3 : NaN) with points pt 5 lc rgb "blue" ps 1
I saved the above file as "year", then generated 24 PNG images for the the years 1991 to 2014 with a BASH for loop. The loop creates year-variants of "year" and passes them to gnuplot for plotting before deleting the variants:
for i in {1991..2014}; do sed "s/YEAR/$i/g" year > $i-config; \
cat $i-config | gnuplot; rm $i-config; done
For a final PNG without red coloring I copied "2014_config" to "2015_config". In the new file I replaced the last two lines with the line "bro" using 2:3 with points pt 5 lc rgb "blue" ps 1 and changed the output filename to "2015.png" (but the label in the plot is still "2014").
Animating. I used ImageMagick to build the GIF animation, in the working folder containing the 25 PNG images:
convert -delay 80 -loop 1 *.png bro.gif
And here's the result. Note that I've set "loop" to 1 (false), so to start or replay the animation, refresh this page in your browser.
Last update: 2022-04-06
The blog posts on this website are licensed under a
Creative Commons Attribution-NonCommercial 4.0 International License