For a full list of BASHing data blog posts see the index page. ![]()
Visualising data as a PGM image
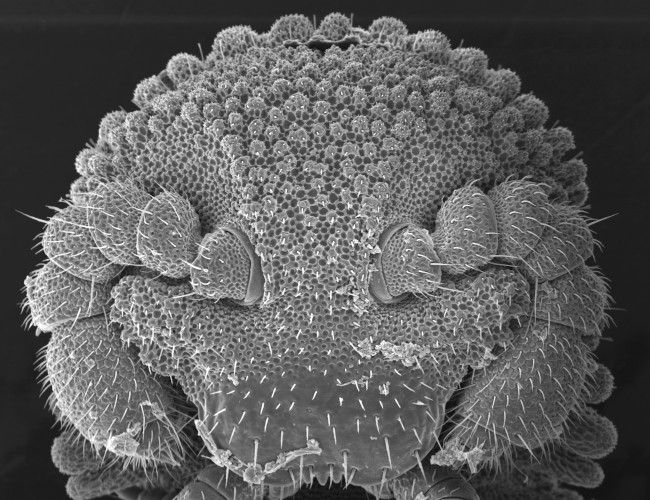
An ASCII PGM file ("Portable Gray Map") is a simple text file that encodes a grayscale image. The image below is "face.pgm" and shows a scanning electron micrograph of the face of a tiny Australian millipede:

The image is actually a PGM converted to a JPEG for display on this webpage.
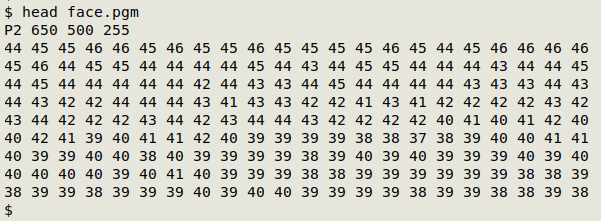
The first 10 lines of "face.pgm" are shown below. The header line has four items. "P2" is a code that identifies the file format as ASCII PGM. The next two items are the width and height of the image in pixels. Since the image is 650 x 500, the total number of pixels in the image is 325000. The last number is the color depth of the image, expressed as the maximum decimal value for this grayscale image, which goes from black (0) to white (255).

Following the header are gray values for the 325000 pixels, one value per pixel. The full RGB triplet for a gray might actually be 160 160 160, but in a PGM the triplet is simplified to the repeated value, 160.
The original micrograph was an LZW-compressed TIFF. I opened it in GIMP to do some brightness/contrast tweaks, scaling and a crop, then exported the file as "face0.pgm" in ASCII format. This file had nearly every data item on a separate line. In a text editor I put the header items on the same line and deleted a GIMP comment, leaving "face0.pgm" as a header plus 325000 lines with one gray value on each.
That seemed a bit excessive, so I decided to pack the gray values on fewer lines. Although the ASCII PGM format is recommended not to have more than 70 characters per line, each of the image viewers I tried (GIMP, ImageMagick, nomacs, Ristretto and LibreOffice Draw) correctly displayed a version of the millipede PGM with all 325000 gray values on a single very long line after the header. In fact, the PGM displayed correctly when the header and all the values were on the same very long line.
For the millipede portrait I went with the 70-character limit and did
(head -1 face0.pgm && tail -n +2 face0.pgm | fmt -w 70) > face.pgm
using the fmt utility from the GBU coreutils package. This packed the 325000 gray values on 16771 lines with 59-69 characters per line.
ASCII PGM is a very simple image format and I wondered if I could apply it to data visualisation. An obvious use would be for 3-parameter data: image width for the "x" value, image height for "y" and various grays for "z" values binned into discrete categories.
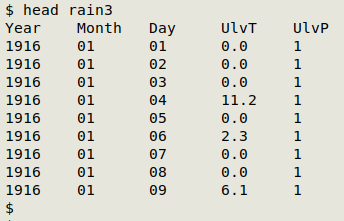
Rummaging through a backup drive full of old datasets that Might Come In Handy Someday™, I found "rain3", whose construction I described in 2017 in a couple of Linux Rain posts. The "rain3" table has daily rainfall totals for my hometown for every day from 1916-01-01 to 2015-12-31, arranged chronologically as shown (field 4 has the rainfall in mm):

That would work as a 365 (days) x 100 (years) PGM, except that 25 of the 100 years had 366 days. I reduced all years to 365 days by adding rainfall on 29 February to rainfall on 28 February and deleting the leap-year days:
tac rain3 | awk 'BEGIN {FS=OFS="\t"} $2=="02" && $3=="29" {add=$4; next} {$4=$4+add; add=""} 1' | tac > rain4
From "rain4" I built a PGM with the following command, putting rainfalls in the four classes <0.2 mm (white), 0.2 - 9.9 mm (light gray), 10.0 - 24.9 mm (darker gray) and > 25.0 mm (black):
cat <(printf "P2 365 100 255\n") \
<(awk -F"\t" 'NR>1 {if ($4 < 0.2) print "255"; \
else if ($4 >= 0.2 && $4 < 10.0) print "153"; \
else if ($4 >= 10.0 && $4 < 25.0) print "102"; \
else if ($4 >= 25.0) print "0"}' rain4) > raintest.pgm
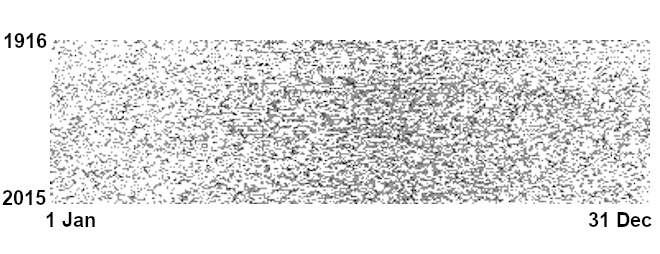
Here's "raintest.pgm", enlarged a bit and with marginal guides:

Squinting through the data noise, the image shows that it's been wettest in my hometown in the austral winter (mainly July and August) and driest in the austral summer (mainly January and February). No new insights there, and there are better ways to plot time-series data. I think I'll call this data-to-PGM exercise a "proof of concept", or maybe "digital art", and move on to more profitable command-line tinkering! It might be useful, though, for other (and larger) datasets.
Last update: 2021-08-04
The blog posts on this website are licensed under a
Creative Commons Attribution-NonCommercial 4.0 International License