For a full list of BASHing data blog posts see the index page. ![]()
Batch triangulation on the command line
This post describes a purpose-built bit of code that you might find useful if you do triangulations.
I know, nobody does triangulations anymore! Except maybe surveyors, and they have gadgets and software that do triangulations automatically. But my wife and her fellow volunteers at a local arboretum still do triangulations "by hand", and often.
As described in an earlier BASHing data post, the arboretum has in-ground marker pegs on a 20 x 20m grid. When a new tree is planted, volunteers measure the distance to the tree from two nearby pegs to the nearest 0.1 m:
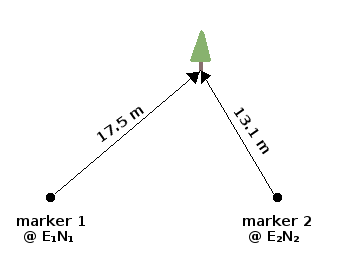
The locations of the pegs are already known as eastings and northings (UTM coordinates), which at this scale can be thought of as "x" and "y" on a plane. So, given those two "x,y" figures and the two measured distances, can you calculate the "x,y" of the new planting by triangulation?
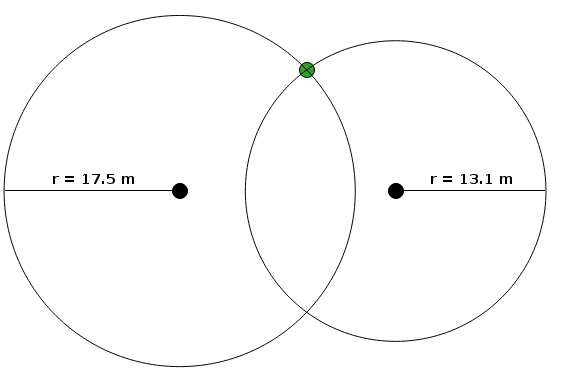
Sure. Actually, you calculate two "x,y" coordinates. As shown below, the tree is at one of the two places where circles drawn around the pegs (at the measured distances) intersect. The calculation doesn't tell you which intersection is correct: you need to judge that by looking at the "x,y"s or (as shown below) by looking at a map.
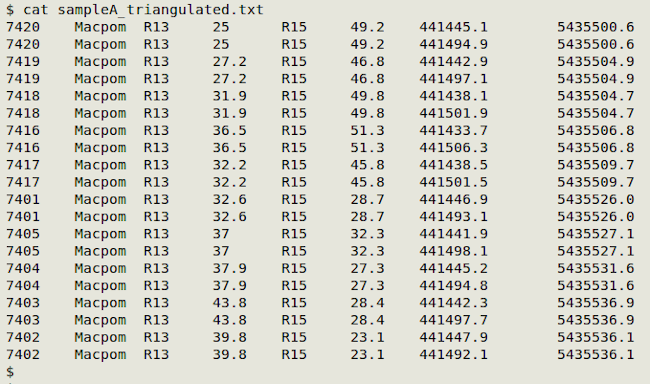
I wrote a script for my wife a couple of years ago that did the calculating job tree-by-tree. I rewrote the script recently to do batch triangulations. The script works on a tab-separated text file like the one shown below, called "sampleA":
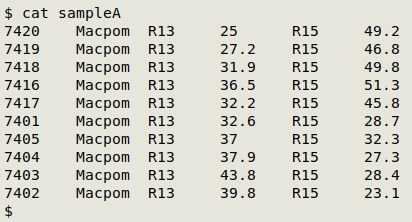
"sampleA" lists 10 new plantings of the tree species abbreviated in field 2 as "Macpom" (Maclura pomifera, Osage Orange). Each tree has a unique ID code (e.g. "7420") in field 1. For each tree, field 3 gives the name of the marker peg from which one measurement was made ("R13" in this case) and field 4 gives that measurement. Field 5 holds the second marker peg ("R15"), and field 6 the second measurement.
The table is fed to the new script, which first does some sanity checks. These ensure that all the needed data are present in the table and that the two circles for each tree do, in fact, intersect (as explained in the earlier post). If the table is OK, it moves to the following command in the script, as shown here for "sampleA":
awk -F"\t" 'FNR==NR {pegE[$1]=$2; pegN[$1]=$3; next} \
{x1=pegE[$3]; y1=pegN[$3]; x2=pegE[$5]; y2=pegN[$5]; \
d3=sprintf("%0.4f",sqrt((x1-x2)^2+(y1-y2)^2)); \
anglebase=sprintf("%0.4f",(d3^2+$4^2-$6^2)/(2*d3*$4)); \
angle=sprintf("%0.4f",atan2(anglebase,sqrt(1-anglebase^2))); \
x3a=sprintf("%0.1f",(x1-$4*cos(atan2(x2-x1,y2-y1)+angle))); \
y3a=sprintf("%0.1f",(y1+$4*sin(atan2(x2-x1,y2-y1)+angle))); \
x3b=sprintf("%0.1f",(x1+$4*cos(atan2(x2-x1,y2-y1)-angle))); \
y3b=sprintf("%0.1f",(y1-$4*sin(atan2(x2-x1,y2-y1)-angle))); \
print $0 FS x3a FS y3a "\n" $0 FS x3b FS y3b}' pegs sampleA > sampleA_triangulated.txt
This is the core of the script and does trigonometric voodoo inside a single AWK command. The output is a table in which each tree record appears twice, each with one of the tree's two possible eastings and northings in fields 7 and 8:
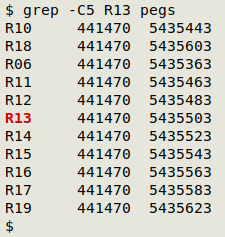
Notice that AWK first builds an array from "pegs", which is a tab-separated lookup table containing eastings and northings for the findable marker pegs:
The last job is to decide which of the two eastings and northings for each tree is correct. While the measurements were being done, the volunteers made a sketch map showing tree locations relative to pegs. This can be compared with a map of "sampleA_triangulated.txt" in a GIS program, and the correct tree locations then identified.
The arboretum uses the excellent open-source GIS program QGIS. "sampleA_triangulated.txt" is loaded into QGIS as a delimited text layer, with the easting field as "x" and the northing field as "y". Here's the result, shown against a background of nearby pegs:
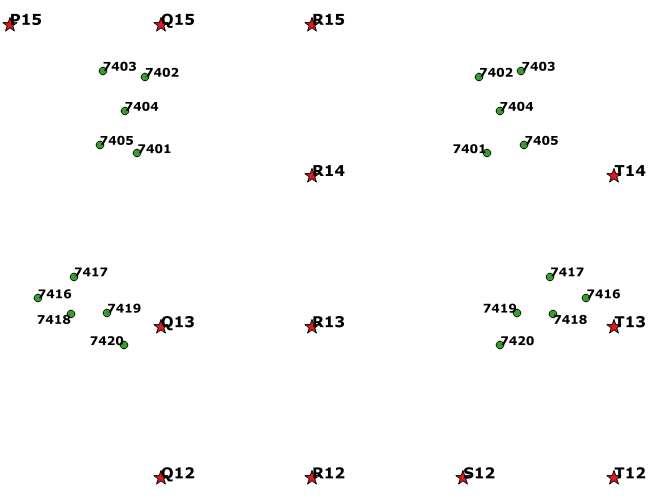
By referring to the sketch map made in the field, the correct mirror-image twin is selected for each tree using a graphical selection tool. The attribute table for the delimited text layer is opened, the selected points are moved to the top of the table and copied to the clipboard. The correct tree locations are then pasted into a text file for further processing and record-keeping (in and out of QGIS).
In case you're wondering why the local arboretum doesn't just GPS the locations of its trees, it's because there's no local base station for improving the accuracy of the GPS readings. Locations at the arboretum with a handheld GPS are currently ±4-5 m, which isn't good enough. In future, when ordinary handheld GPS receivers have centimeter accuracy, the arboretum will stop doing triangulations!
Last update: 2021-06-09
The blog posts on this website are licensed under a
Creative Commons Attribution-NonCommercial 4.0 International License