
For a full list of BASHing data blog posts see the index page. ![]()
Converting a list to a presence/absence table
Structured and tidy data is great to work with, because on the command line you can reliably convert one structure into another. For example, here's the text file "plots":
p1
nocu,atmo,dian,acme
p2
euob,nocu,atmo,dian
p3
euob,acme,acde,lela,pibi
p4
nocu,eulu,atmo,dian,phas,ceni
p5
nocu,eulu,anbi,phas
p5
nocu,phas,euni,legl,eulu,anbi,phas
p6
euob,euni,phas,legl,lesc
p7
nocu,atmo,dian,angl,anbi
p8
acde,phas,nocu,lela
The file was created by an (imaginary) ecologist who visited 8 forest plots (p1 - p8) and on each plot recorded tree species. The recording was done with a simple note-taking app on the ecologist's phone. For each plot there's a plot-code line followed by a line with comma-separated, 4-letter species codes. Notice that in "p5" the code "phas" is unnecessarily repeated.
Back in her office, the ecologist puts "plots" on her laptop before doing an analysis of the tree data based on presence/absence. Her analytical software, though, wants a tab-separated species-vs-plots table where a "1" in the table will indicate presence and "0" an absence.
The ecologist could do the data reformatting manually in a spreadsheet, then export the spreadsheet as a TSV. However, this would take time and she might make data entry errors. (And the more the transects and species codes, the longer it would take and the greater the chance of error.) A faster and less error-prone method is to use the command line and the excellent GNU datamash:
paste - - -d"," < plots \
| awk -F"," '{for (i=2;i<=NF;i++) print $i"\t"$1}' \
| sort | uniq \
| datamash --filler="0" crosstab 1,2 \
| sed '1s/^/sp/'
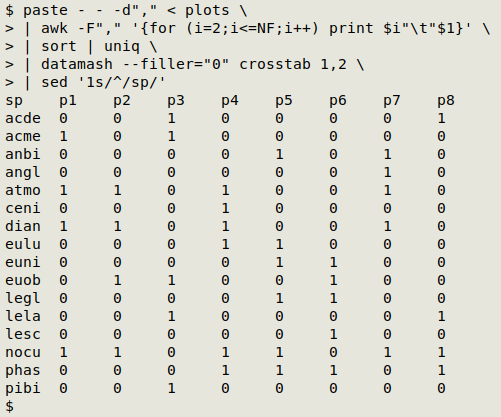
This is actually a one-liner, and for the screenshot above I've reduced the tab spacing in my terminal, to save space.
paste (paste - - -d",") creates comma-separated strings of plots and codes, like this:
p1,nocu,atmo,dian,acme
p2,euob,nocu,atmo,dian
p3,euob,acme,acde,lela,pibi
p4,nocu,eulu,atmo,dian,phas,ceni
p5,nocu,eulu,anbi,phas
p5,nocu,phas,euni,legl,eulu,anbi,phas
p6,euob,euni,phas,legl,lesc
p7,nocu,atmo,dian,angl,anbi
p8,acde,phas,nocu,lela
The strings are piped to AWK, and for each of the tree codes (which begin with field 2, for (i=2;i<=NF;i++)) AWK prints the code, a tab and the plot code in field 1 (print $i"\t"$1). The output is a long, tab-separated list of tree codes and the plots they were found on. The list is piped to sort and uniq to get rid of duplicates like "p5[tab]phas".
The sorted and uniquified list now goes to datamash, which generates a pivot table with the count of tree codes on plots (datamash --filler="0" crosstab 1,2). The count will be "1" for any presences, and "N/A" for any absences, but the "--filler ="0" option substitutes "0" for "N/A". The "crosstab" operation normally requires sorting (with the "-s" option), but this has already been done by sort.
The last command uses sed to tweak the datamash pivot table. The string "sp" is put at the beginning of line 1, where datamash leaves a gap (sed '1s/^/sp/'...).
If the ecologist wanted to do this kind of data re-structuring regularly, she could put her code into a BASH script to save re-entering it each time. The script could include tidying commands for the plot file, e.g. to remove blank lines, unwanted spaces and extra commas.
Last update: 2021-02-10
The blog posts on this website are licensed under a
Creative Commons Attribution-NonCommercial 4.0 International License