For a full list of BASHing data blog posts, see the index page. ![]()
Data with bulges
Data analysis sometimes turns up unexpected "bulges" in the value of data items. Forensic auditors are trained to look for such things in business and banking accounts, because a bulge might be evidence of fraud or embezzlement. In the three examples below, bulges appear for more innocent reasons.
The Benford effect. If you take a long column of numbers in a dataset and clip out the first digit of each number, you'll usually find that the digits 1 to 9 aren't evenly distributed. There will often be a skew towards the lower digits, and the digit "1" will bulge strongly.
Here's an example from Queensland (Australia) traffic statistics. I looked at the Annual Average Daily Traffic (AADT), which is the number of vehicles passing a point on a road in a 24 hour period averaged over a calendar year. Over ca 2200 monitoring points, the AADT for 2017 varied from 0 vehicles to 168618 vehicles. The graph below shows the distribution of first digits in the AADT figures:
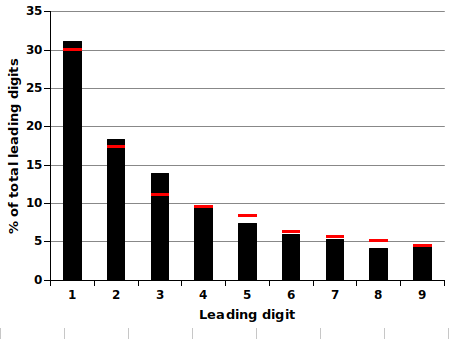
The red bars on the graph are the predicted values according to what's usually called Benford's Law. Not a bad fit for this particular set of numbers, but not all datasets behave this way.
The Wikipedia article on Benford's Law is very good, and I also recommend this 2011 summary by forensic accountant Tommie Singleton.
To get the numbers for the graph (built in a Gnumeric spreadsheet), I downloaded the 2017 traffic stats as a CSV and converted the CSV to a TSV with the c2t function. I then cut out the AADT field (cut -f5), piped the field to a cut of the first character (cut -c1) and piped the first characters to sort -n followed by uniq -c.
Forest assessment. Twenty years ago I did an analysis of ca 7800 assessment plots in native Tasmanian forest. On each of those plots, forest assessors counted and measured the commercially valuable trees. They would then use the measurements to calculate how much sawlog (in cubic metres) could be harvested from the plot, using a volume formula based on tree diameter and sawlog height (the height above ground at which the tapering, cylindrical trunk of the tree broke up into one or more large branches).
Tree diameter was measured with a tape at breast height, ca 1.3 m. Sawlog height was estimated by eye. The graph below shows the distribution of sawlog height estimates for 2736 trees on the ca 7800 plots. The bulges in even-numbered heights are spectacular.
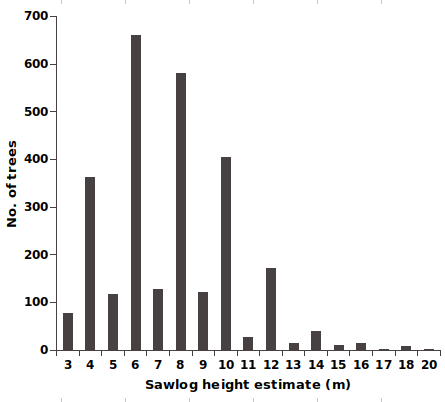
The estimates were made by a number of different forest assessors and the bias can't be blamed on a single individual. I'm not sure what was going on, but it looks like assessors were rounding their estimates up or down to the nearest multiple of 2 m. Why 2 m? Hold your arm out and spread your thumb and index finger so that they roughly cover the same height in your visual field as that of a fellow forest assessor, who is (say) 1.7 m tall and standing by the sawlog tree. Adjust the thumb-index finger spread to about 2 m. Now estimate sawlog height by moving your hand in ca 2 m units up the tree trunk...
Did the bias arise this way? I don't know, but I've often wondered how those 2 m-height bulges were affecting the calculated sawlog volumes.
Database field truncation. In an earlier BASHing data post I described three methods for checking whether data items had been truncated, for example by entry of a 110-character string into a database field with a 100-character limit.
I've noticed that database field truncations tend to cluster around 50, 100, 200 and 255 characters. Here's a 255-er from the GBIF Backbone Taxonomy. The tab-separated, plain-text table I looked at is "Taxon.tsv", which contains 5,858,142 records of scientific names, and field 14 is "namePublishedIn".
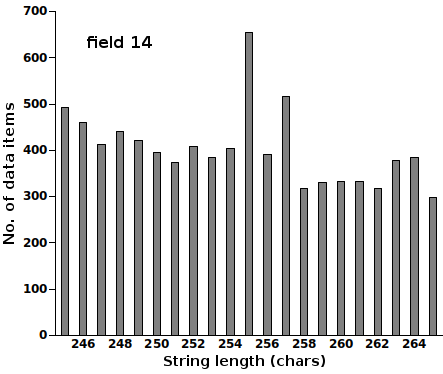
Note that these are unique data items (see code comment below). Inspection of the 255-character strings shows that the bulge includes some obviously truncated strings, such as these three:
in Wen, Lan, Chen, Zhang, Chen & Gu, in Zhongguo Kexue Yuan, Xizang Kexue Kaochadui [Acad. Sinica. Tibetan Sci. Exped. Team], Zhumulangmafeng diqu kexue kaocha baogao 1966-1968. [A report of the scientific expedition in the Mo Jolmo Lungma (Everest) regio
Rice, A.L. & Miller, J.E. (1991) Chirostylid and galatheid crustaceans associates of coelenterates and echinoderms collected from the Johnson-Sea-Link submersible, including a new species of Gastroptychus. Proceedings of the Biological Society of Washingt
Newton, R. B. 1891. Systematic list of Frederick E. Edwards collection of British Oligocene and Eocene Mollusca in the British Museum (Natural History), with references to the type-specimens from similar horizons contained in other collections belonging t
There's another bulge at 257 characters, but that seems to have mainly been caused by 179 data items of the form
where "nnn" is a 3-digit number and the HTML markup is in the original. If I subtract 179 data items from the 257-character total of 517, I get 338 data items, which looks OK for that position on the bar graph.
Because I was looking for lengths of unique strings, I couldn't just tally all the string lengths in field 14 in "Taxon.tsv". To get unique string lengths and their frequencies I could either use
awk -F"\t" 'NR>1 {a[$14]=length($14)} END {for (i in a) print a[i]}' Taxon.tsv | sort -n | uniq -c > 14list
or
tail -n +2 Taxon.tsv | cut -f14 | sort | uniq | awk '{print length($0)}' | sort -n | uniq -c > 14list
In the first command, putting the field 14 data items into an AWK array automatically uniquifies them.
Last update: 2020-01-13
The blog posts on this website are licensed under a
Creative Commons Attribution-NonCommercial 4.0 International License