
For a full list of BASHing data blog posts, see the index page. ![]()
Has the rainfall pattern in my hometown changed?
One of the predicted effects of climate change is that it may rain less often in your part of the world, but that rainfall will be greater during rainy periods. I've often heard something like that from my older Tasmanian neighbours, too: Years ago it would drizzle and rain for weeks on end. Now we get long dry spells, and when it finally rains, it buckets down. The rain used to be spread out more.
I wonder if this Tasmanian story might be biased by the ages of my neighbours. Are they thinking back to a particularly wet period when they were young? Maybe 80-100 years ago the rainfall pattern was more like today's?
I've got a dataset handy to investigate this question, namely the 36525 daily rainfall totals for my hometown from 1916 through 2015, in chronological order. In two posts in 2017 on the Linux Rain blog (here and here) I explained how I built the dataset. In a follow-up post I analysed one-day rainfall totals. Here I look at rainfall events — how many days they lasted, and how much rain fell during each set of wet days.
As usual, I'll use AWK to process the raw data. In the example file "demo1" (see screenshot below), the fields are year, month, day and rainfall total. The AWK command prints the year of the event, the rainfall total in the event, and the number of days over which rain fell. Note that I'm ignoring rainfall totals under 0.3 mm (see below for more on this threshold).
awk -F"\t" '$4>0.2 {year=$1; rain+=$4; days++} $4<=0.2 && days>0 {print year FS rain FS days; year=rain=days=""}' demo1
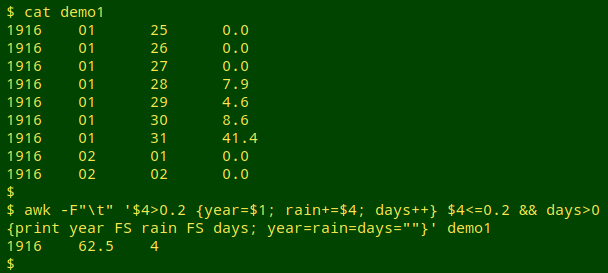
AWK is told with -F"\t" that the field separator is a tab character. As AWK processes "demo1" line by line, it checks to see if field 4 is greater than 0.2. If it is, the year in field 1 is stored in the variable "year", the rainfall total is added to the variable "rain" and 1 is added to the "days" variable. If field 4 is less than or equal to 0.2 mm and there's a number greater than zero in "days" (this is the first day after a rain event), then AWK prints the year, a tab, the accumulated total and the number of days over which that rainfall accumulated. Following the print, AWK resets the 3 variables to an empty string. The first 3 lines of "demo1" don't trigger an AWK action, because "days" is still empty.
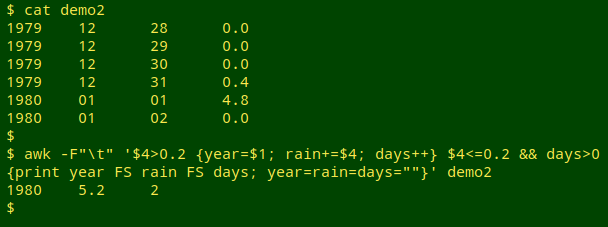
Because "year" is reset on every day with rain over the threshold, a rain event spread over 2 successive years is printed as happening in the second year, as shown below for "demo2":
The command for extracting the 1916-2015 rainfall events and saving them as "evts" is shown below; it first strips off the header line in "rain3" with tail.
tail -n +2 rain3 | awk -F"\t" '$4>0.2 {year=$1; rain+=$4; days++} $4<=0.2 && days>0 {print year FS rain FS days; year=rain=days=""}' > evts
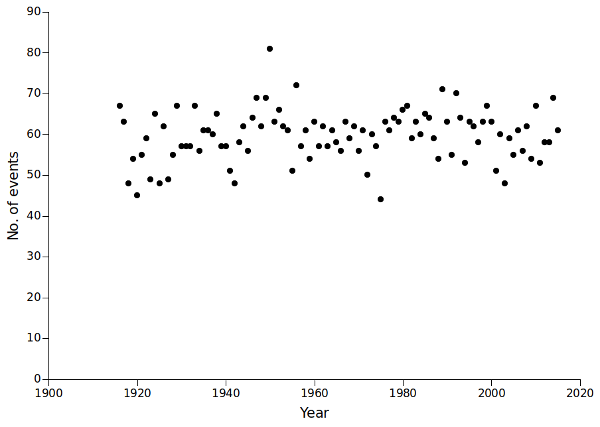
The result is 5957 rainfall events over the 100 years. The number of events per year was pretty stable from 1916 to 2005:
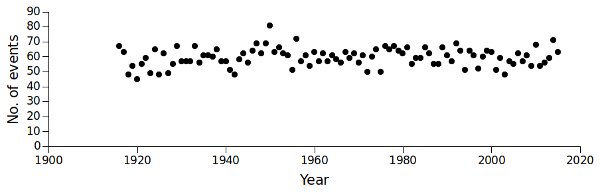
awk -F"\t" 'BEGIN {print "Year" FS "Events"} {y[$1]++} END {for (i in y) print i FS y[i]}' evts > number_of_events
The number of occurrences of each year in "evts" is stored in in the array "y". When the line-by-line processing of "evts" is finished, AWK prints the year and the number of events in that year.
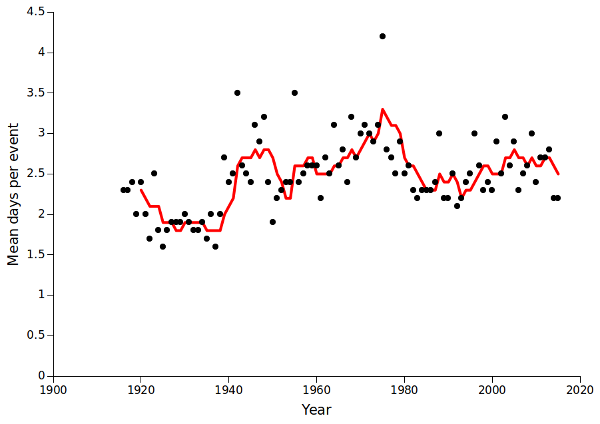
Did the length of rainfall events vary over the years? One measure is mean number of days per event. That measure definitely trended (see graph below; red line is 5-year moving average). It looks like today's events might seem shorter to someone in their 60s or 70s, remembering the rains of their youth. Centenarians might think that today's rainy spells are longer, if those short events of the 1920s and 1930s are real and not data artifacts.
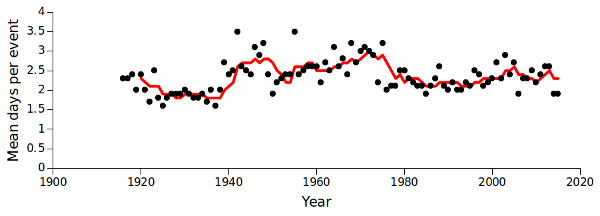
awk -F"\t" 'BEGIN {print "Year" FS "Mean event length"} {y[$1]++; l[$1]+=$3} END {for (i in y) printf("%s\t%.1f\n",i,l[i]/y[i])}' evts > event_length
The total length of events each year is stored in the array "l". The final output is year, tab and total length of events divided by total events, calculated to the nearest 0.1 day.
How about the amount of rain per event? Well, looking at the 5-year moving average (below, blue line), I can't see a big trend upwards. Some ups and downs, but fairly flat overall.
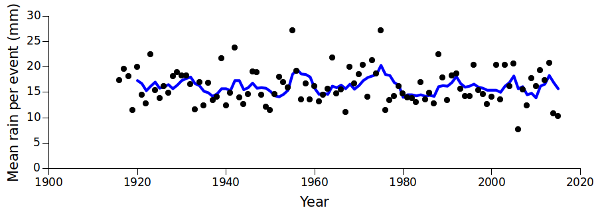
awk -F"\t" 'BEGIN {print "Year" FS "Mean rainfall per event"} {y[$1]++; f[$1]+=$2} END {for (i in y) printf("%s\t%.1f\n",i,f[i]/y[i])}' evts > event_rainfall
The total rainfall in the listed events each year is stored in the array "f". The final output is year, tab and total rainfall divided by total events, calculated to the nearest 0.1 mm.
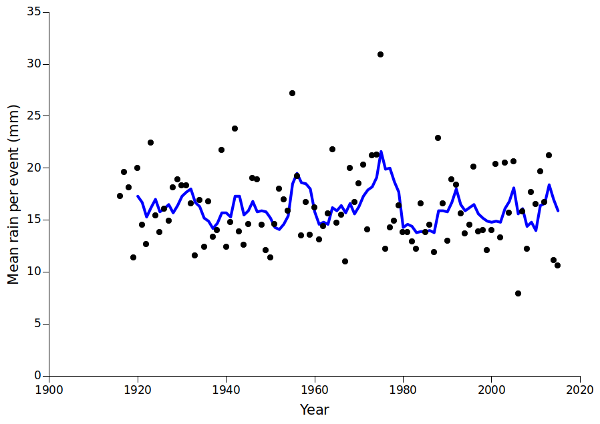
I chose 0.3 mm as my rainfall threshold to reduce data noise, but the results aren't much different with any recorded rain (daily total more than 0.0 mm) making up part of a rainfall event, as shown below. These 3 graphs are twice the height of those above, to emphasise the "y" dimension:
tail -n +2 rain3 | awk -F"\t" '$4>0 {year=$1; rain+=$4; days++} $4==0 && days>0 {print year FS rain FS days; year=rain=days=""}' > evts0
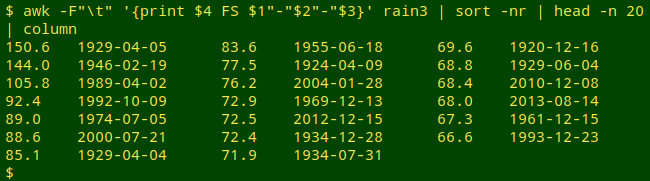
If I can trust the data, it doesn't seem that there have been major changes in the pattern of rainfall events in my hometown in recent years. Tasmania doesn't suffer as much as mainland Australia from weather extremes, and my hometown sits on the edge of the climate-buffering ocean. My neighbours could be right about the "bucketing down", though. Of the top 20 1-day falls in 1916-2015, 8 were recorded in the last 20 years of the period:
The graphs and the 5-year moving averages were built in a Gnumeric spreadsheet.
Last update: 2018-12-23
The blog posts on this website are licensed under a
Creative Commons Attribution-NonCommercial 4.0 International License