
For a full list of BASHing data blog posts, see the index page. ![]()
Pivoting airlines
Among the publicly available datasets on the Australian Government's open data portal is a periodically updated table of "on time performance" data for Australia's domestic airlines.
The busiest flying route in Australia is Sydney-Melbourne/Melbourne-Sydney, and the two biggest passenger carriers on that route are Qantas and Virgin Australia. To compare their performances I downloaded the latest table (otptimeseriesweb.csv, 20 May 2018) and converted the CSV to a TSV. I then selected Qantas and Virgin Australia from the "Airline" field and Melbourne-Sydney and Sydney-Melbourne from the "Route" field, and pruned the table (now called "sydmel") to the following 11 fields:
1 Route
2 Airline
3 Sectors_Scheduled
4 Sectors_Flown
5 Cancellations
6 Departures_On_Time
7 Arrivals_On_Time
8 Departures_Delayed
9 Arrivals_Delayed
10 Year
11 Month_Num
The reduced dataset covers the 172 months from January 2004 to April 2018. What I wanted from the dataset was delays and cancellations neatly broken down by year, route and airline. I also had...er... one small additional requirement. I wanted to generate each table in the terminal with a single AWK command.
Below is a screenshot of the "Departures_Delayed" AWK command and its output. (The command is explained later in this post.) Note that A flight departure is counted as "on time" if it departs the gate before 15 minutes after the scheduled departure time shown in the carriers' schedule, according to the data publishers.
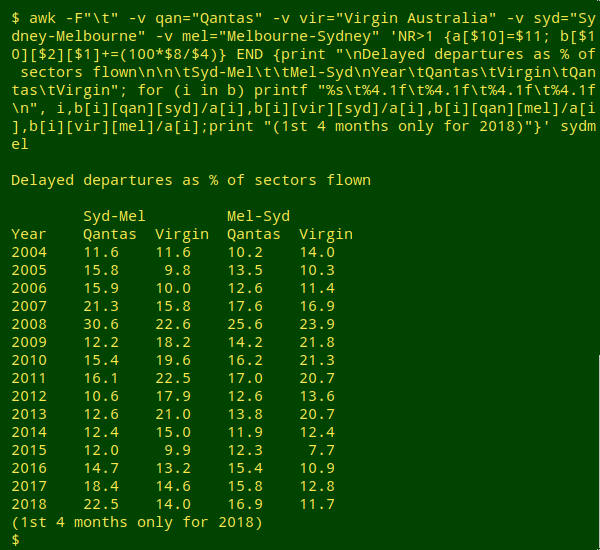
The "Arrivals_Delayed" and "Cancellations" summaries had similar patterns to "Departures_Delayed". There wasn't a huge or consistent difference in performance between Qantas and Virgin Australia. Qantas was better than Virgin in some years and worse in others. But look at Qantas' performance in 2008 (above)! What happened? As shown below, the 2008 blow-out in delays had a mid-year peak:
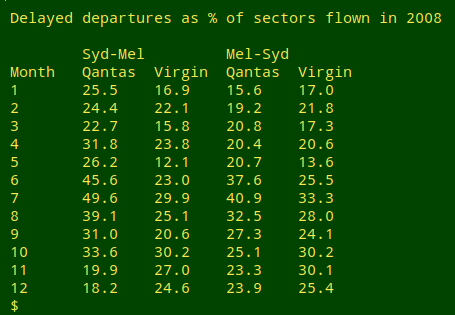
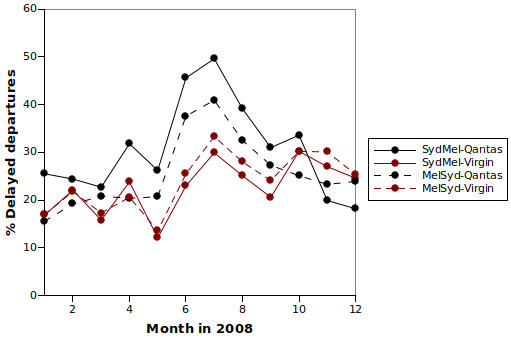
Was it really that bad? Were half the Sydney-Melbourne Qantas flights delayed in July? Yes indeed: the raw data were 410 delayed departures out of 826 flights. According to the Qantas annual report for 2007-2008, During the final quarter of the [financial] year, an industrial dispute between Qantas and the Australian Licensed Aircraft Engineers Association affected the reliability of the network. In the 2008-2009 annual report, Our customers...experienced punctuality issues deriving from a long-running engineering industrial dispute and subsequent maintenance backlog...
Love that Qantas corporate-speak. Next time I'm late for an appointment I'll say Sorry, I'm experiencing a punctuality issue.
Here's the AWK command for the delayed departure table, "exploded" so its parts are more easily seen:
awk -F"\t" \
-v qan="Qantas" -v vir="Virgin Australia" \
-v syd="Sydney-Melbourne" -v mel="Melbourne-Sydney" \
'NR>1 {a[$10]=$11; b[$10][$2][$1]+=(100*$8/$4)} \
END {print "\nDelayed departures as % of sectors flown\n\n \
\tSyd-Mel\t\tMel-Syd\nYear\tQantas\tVirgin\tQantas\tVirgin"; \
for (i in b) printf "%s\t%4.1f\t%4.1f\t%4.1f\t%4.1f\n", \
i, \
b[i][qan][syd]/a[i], \
b[i][vir][syd]/a[i], \
b[i][qan][mel]/a[i], \
b[i][vir][mel]/a[i]}; \
print "(1st 4 months only for 2018)"}' sydmel
I first tell AWK that the field separator in the table "sydmel" is the tab character (-F"\t"). I then define 4 variables that store the 2 values each in the "Airline" and "Route" fields. Those values will be used later in the command and storing them as 3-letter variables saves me some typing.
The action part of the AWK command begins with a request for AWK to ignore the header line of "sydmel" (NR>1). Next I create an array "a" that stores for each value of "Year" (field 10) the total number of months (from field 11) for which "sydmel" has data. These figures will be used in the END statement.
The second action statement creates an array of arrays. The main array "b[$10]" is indexed by year (field 10), and it contains a subarray "b[$10][$2]" indexed by airline (field 2). That subarray in turn has a subarray, "b[$10][$2][$1]", indexed by route (field 1). This array of arrays is set to add up (+=) the number of delayed departures (field 8) divided by the number of flights flown (field 4) times 100. What's being added up are the calculations for each month in the array of arrays, or in other words for each route, airline and year separately. Each calculation is the first part of an annual percentage calculation in the END statement.
The END statement begins by printing header lines and ends by printing a footer line. Between headers and footers, AWK "walks through" the array of arrays, and for each year AWK divides the value of the specified airline/route combination by the number of months of data in that year, giving the annual percentage. The percentages are neatly formatted with printf as right-justified, 4-character figures rounded to the nearest 0.1 (%4.1f).
And here's the exploded command for the 2008-only table:
awk -F"\t" \
-v qan="Qantas" -v vir="Virgin Australia" \
-v syd="Sydney-Melbourne" -v mel="Melbourne-Sydney" \
'$10==2008 {a[$11]; b[$11][$2][$1]+=(100*$8/$4)} \
END {print "\nDelayed departures as % of sectors flown in 2008\n\n \
\tSyd-Mel\t\tMel-Syd\nMonth\tQantas\tVirgin\tQantas\tVirgin"; \
for (i in a) printf "%s\t%4.1f\t%4.1f\t%4.1f\t%4.1f\n", \
i, \
b[i][qan][syd], \
b[i][vir][syd], \
b[i][qan][mel], \
b[i][vir][mel]}' sydmel
Last update: 2018-06-03
The blog posts on this website are licensed under a
Creative Commons Attribution-NonCommercial 4.0 International License